Starting a new profile session
Profiling an already running processes
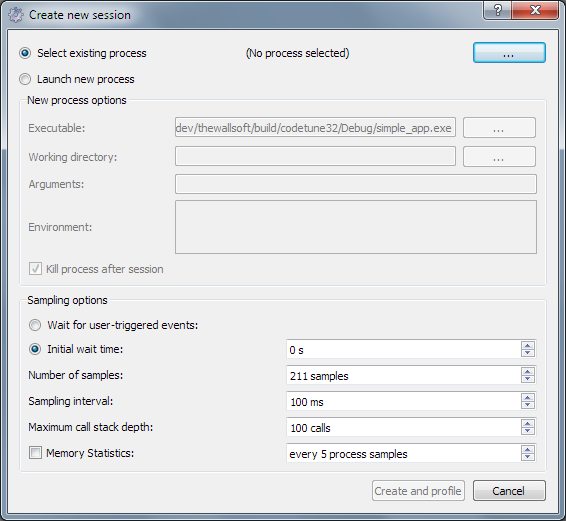
CodeTune can attach to a running process and start collecting samples. Use the top level menu Session and select New to create a new profiling session.
Use the “Select an existing process” and press the ellipsis to get a list of process that CodeTune can profile. The list of process will be shown as the image name, the process ID and the architecture of the binary code.
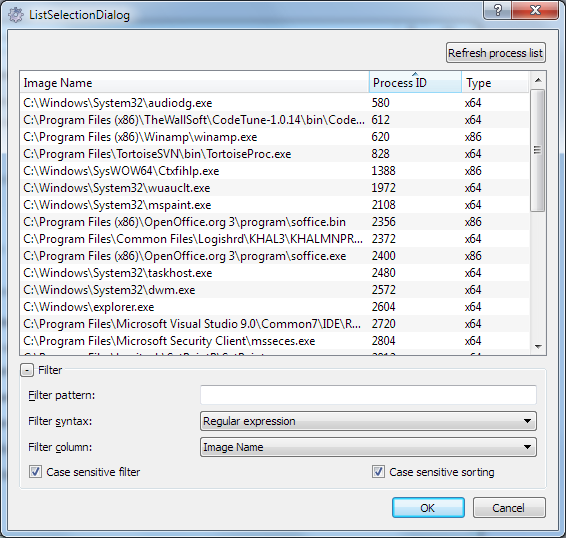
Only processes that can be profiled will be listed. If CodeTune is executed by a user with regular rights, device drivers and processes running at elevated rights, will not be eligible for profiling. To also profile these process, run CodeTune under elevated rights (say as Administrator).
Profiling a newly created process
A process can be created by CodeTune for profiling. Use the “Launch new process” option to set up profiling for a newly created process. The executable is the executable that will be profiled. Enter the working directory of the new process, if left blank the working directory will be that of the running CodeTune process. It is strongly recommended to enter a meaningful working directory. Optionally specify the arguments that need to be passed to executable. The environment section allows to change the environment that the processes will experience. An example:
PATH=%PATH%;c:\temp\my_lib_dlls
TESTFLAG=write_debug
Environment variable specifications are separated by new lines. Existing environment variables can be used by using the regular Windows shell convention of surrounding them with percentage signs.
At the end of the session the process can be killed if desired by ticking the “Kill process after session”.
Setting sampling options
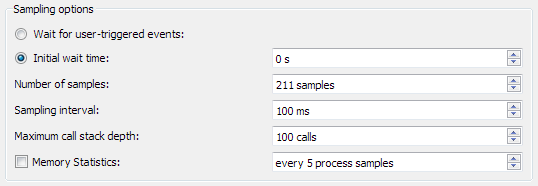
CodeTune samples the call stacks of the process being profiled. The time between samples is controlled by the “Sampling interval”. Decreasing the time between samples will increase the overhead that CodeTune brings to the running process. The overhead induced is reported in the log. The overhead is caused by the call stack sampling. For each sample CodeTune will walk the call stack for all threads. To reduce overhead either increase the time between samples or limit the call stack traversal depth by lowering the “Maximum call stack depth” setting. On a modern system a sampling interval of 50ms is advised if the number of threads is less than 10. Although the overhead adds to the wall clock time of the process it should be barely noticeable in the user time. The overhead of the sampling is counted towards the CodeTune process and not to the process being profiled.
Collecting memory statistics
An experimental feature of CodeTune is to collect memory statistics. When enabled CodeTune will track the memory usage of the process being profiled. Presently the results of the collection are presented only as a list to browse through without statistical processing.
Starting profiling session: user-triggered events and initial wait
The start of the profiling session can be done in two ways: wait for given time to start or let the process itself decide when to start and stop. When the initial wait time is chosen, CodeTune will attach to the process and wait up to the given time to start collecting samples. Note that while a best effort is made to honour the exact value of the initial wait time, a too low wait time is difficult to achieve.
If the start and end of a session needs to be controlled very tightly it is advised to use the “user-triggered events”. These require the developer to instrument the process. CodeTune offers a C++ and Python library to do this.
C++ User-Triggered Events
In the installation folder of CodeTune there is a directory called “src” that contains code_tune_lib.h. Usage is as follows:
#include "code_tune_lib.h"
int main(int argc, char** argv)
{
    codetune::startSampling();
    codeToBeSampled();
    codetune::stopSampling();
    return 0;
}
The library CodeTuneEvent.lib from the installation folder/bin has to be linked in. This library has no dependencies on a C/C++ run-time and will not interfere with it. It is built for minimal intrusion. A process instrumented with the user-triggered events does need to have access to the CodeTuneEvent.dll. Either extend the PATH variable to the bin directory of the installation of CodeTune or copy CodeTuneEvent.dll to the location where the executable containing the events will be placed.
Python User-Triggered Events
For convenience, also a Python wrapper is given for the CodeTuneEvent library. Pre-built binaries are distributed for Python 2.5, 2.6, 2.7, 3.0, 3.1 and 3.2. However if these are insufficient or incompatible (the pre-built binaries are built using Visual Studio 9.0/2008), then the source code for the wrapper can be found in the “src” sub-directory of the installation folder.
Usage in Python is as follows:
import codeTuneEvent
codeTuneEvent.startSampling()
codeTuneEvent.stopSampling()
The “bin” sub-directory of the installation folder of CodeTune will need to be added to the PATH and PYTHON_PATH. Alternatively only add the “bin” directory to the PATH and do as follows:
import sys
sys.path.append(r"C:\Program Files (x86)\TheWallSoft\CodeTune-1.0.14\bin")
import codeTuneEvent
codeTuneEvent.startSampling()
codeTuneEvent.stopSampling()
Viewing the results
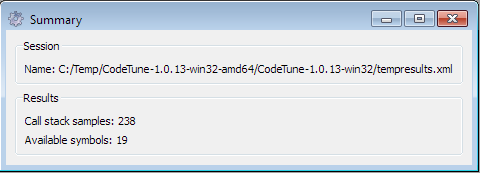
After a session was completed succesfully a number of results will be shown by default. At any time these results can be retrieved through the “Results” top-level menu. The “Summary” results show a brief overview of where the session results are stored, how many samples were taken and how many symbols were resolved:
Sampling Results
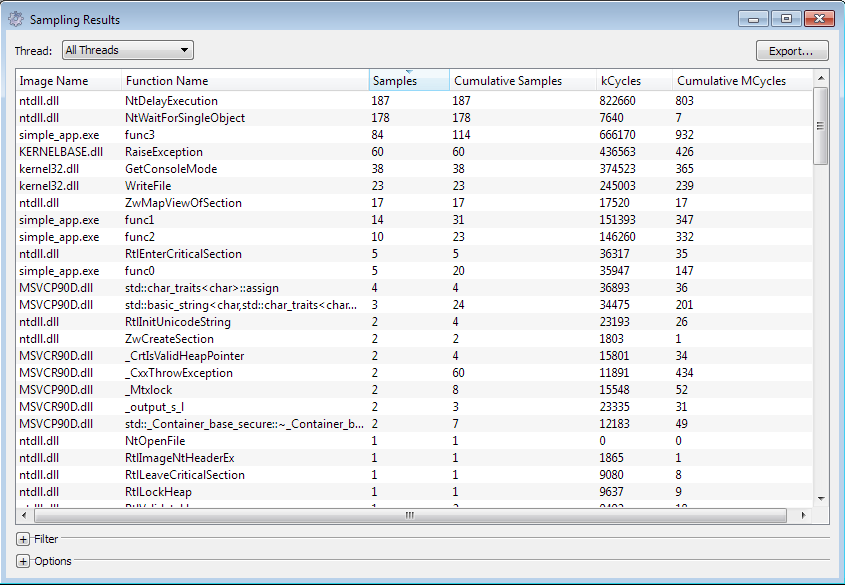
To view the results on a function level use the “Sampling Results” type. Six columns will be displayed:
- Image Name: the name of the module image: this is typically either the main executable or a dll being used by the main executable
- Function Name: the name of the function
- Samples: the number of samples being taken where the given function as at the bottom of the call stack
- Cumulative Samples: the number of samples where the function was anywhere on the call stack. This number will hence be always be equal or higher than the number under “Samples”.
- kCycles: the estimated number of thousand cycles that the CPU used to execute this function.
- Cumulative MCycles: the estimated number of million cycles that the CPU used to execute this function and its descendants.
The results can be shown aggregated for all threads or per thread using the combo-box at the top of the window. At any time the results can be filtered using the settings at the bottom of the results dialog.
Results shown in the dialog can be exported by using the “Export …” action. The results are exported in a .csv that can be used for processing in an external tool.
Sampling Results (Module)
The results can be aggregated per module for a quick overview which modules take up the most time.
Hot Path Stack
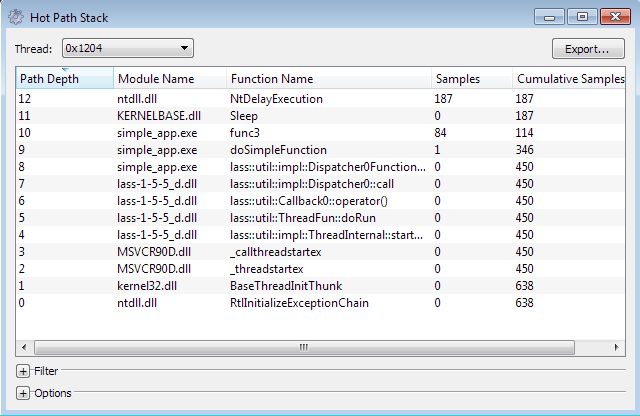
The hot path stack shows the hot path per threads or globally for all threads. The hot path per thread is the most reliable, global hot path can be skewed towards function used in multiple threads but not necessarily in the same code sequence. Functions on the hot path represent the call stack where proportionally most time is spent during the duration of the profile session. The functions on the hot path make good candidates to consider for revision to improve performance.
Using the context menu on a function the source code can be retrieved or the call graph for the function:
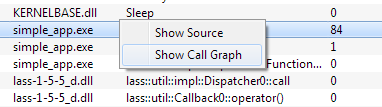
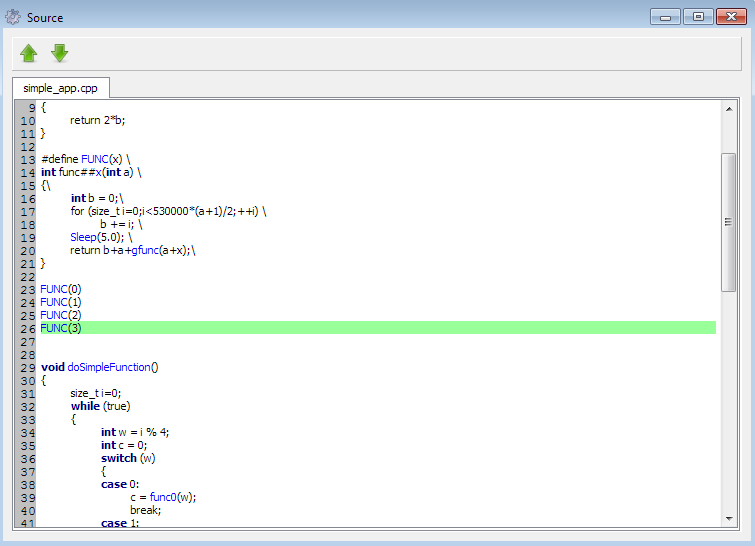
The source code will be displayed within CodeTune and a book mark will be set to the function that was chosen.
The call graph of the function can be displayed as well. When there are functions part of the hot path they will be marked in red.
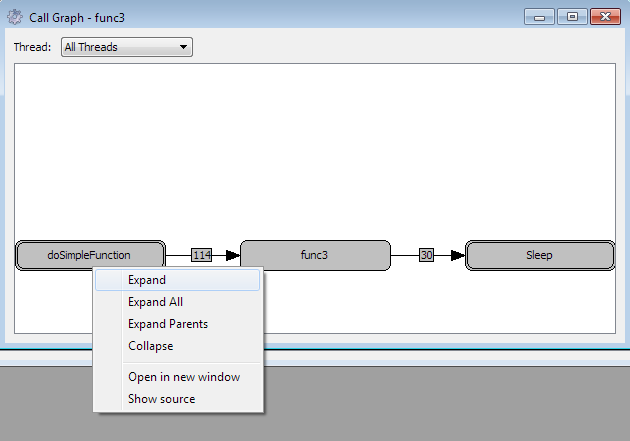
Once the call graph is shown a number of actions are supported on the call graph:
- Expand: expands the current node and shows all its children
- Expand All: expand children as well as parents
- Expand Parents: expands the currents node parents: any function calling this function will be displayed.
- Collapse: removes the current node from the call graph: it can be retrieved later by clicking on one of its children and asking to expand the parents or clicking on one of the parents and to expand its children.
- Open in new window: takes the current node and opens a new window to display the call graph.
- Show source: displays the source of the function.